How to Present Data in Columns
Updated on Published on
Article summary
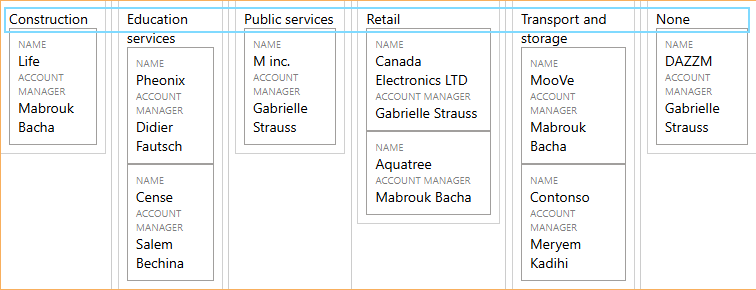
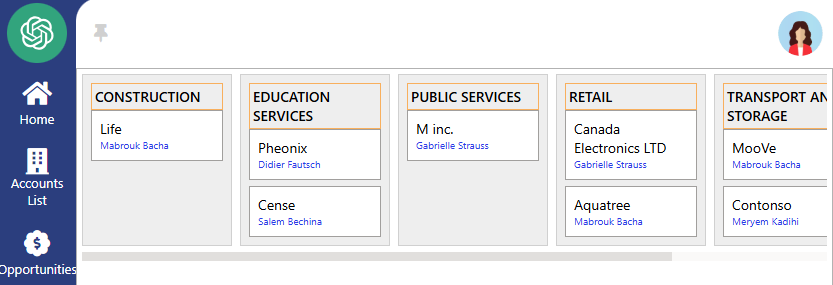
To organize your data efficiently, you can present it in columns using a table that categorizes the information according to a specific field. For example, by working with an aggregate such as "Account" and using the "Industry" field (which should be under the parent entity or aggregate) to group the data, you can achieve a clear and structured result. The final result is a dynamic table where each column represents an industry, with the ability to explore the associated accounts directly via a dedicated…
Step-by-step instructions
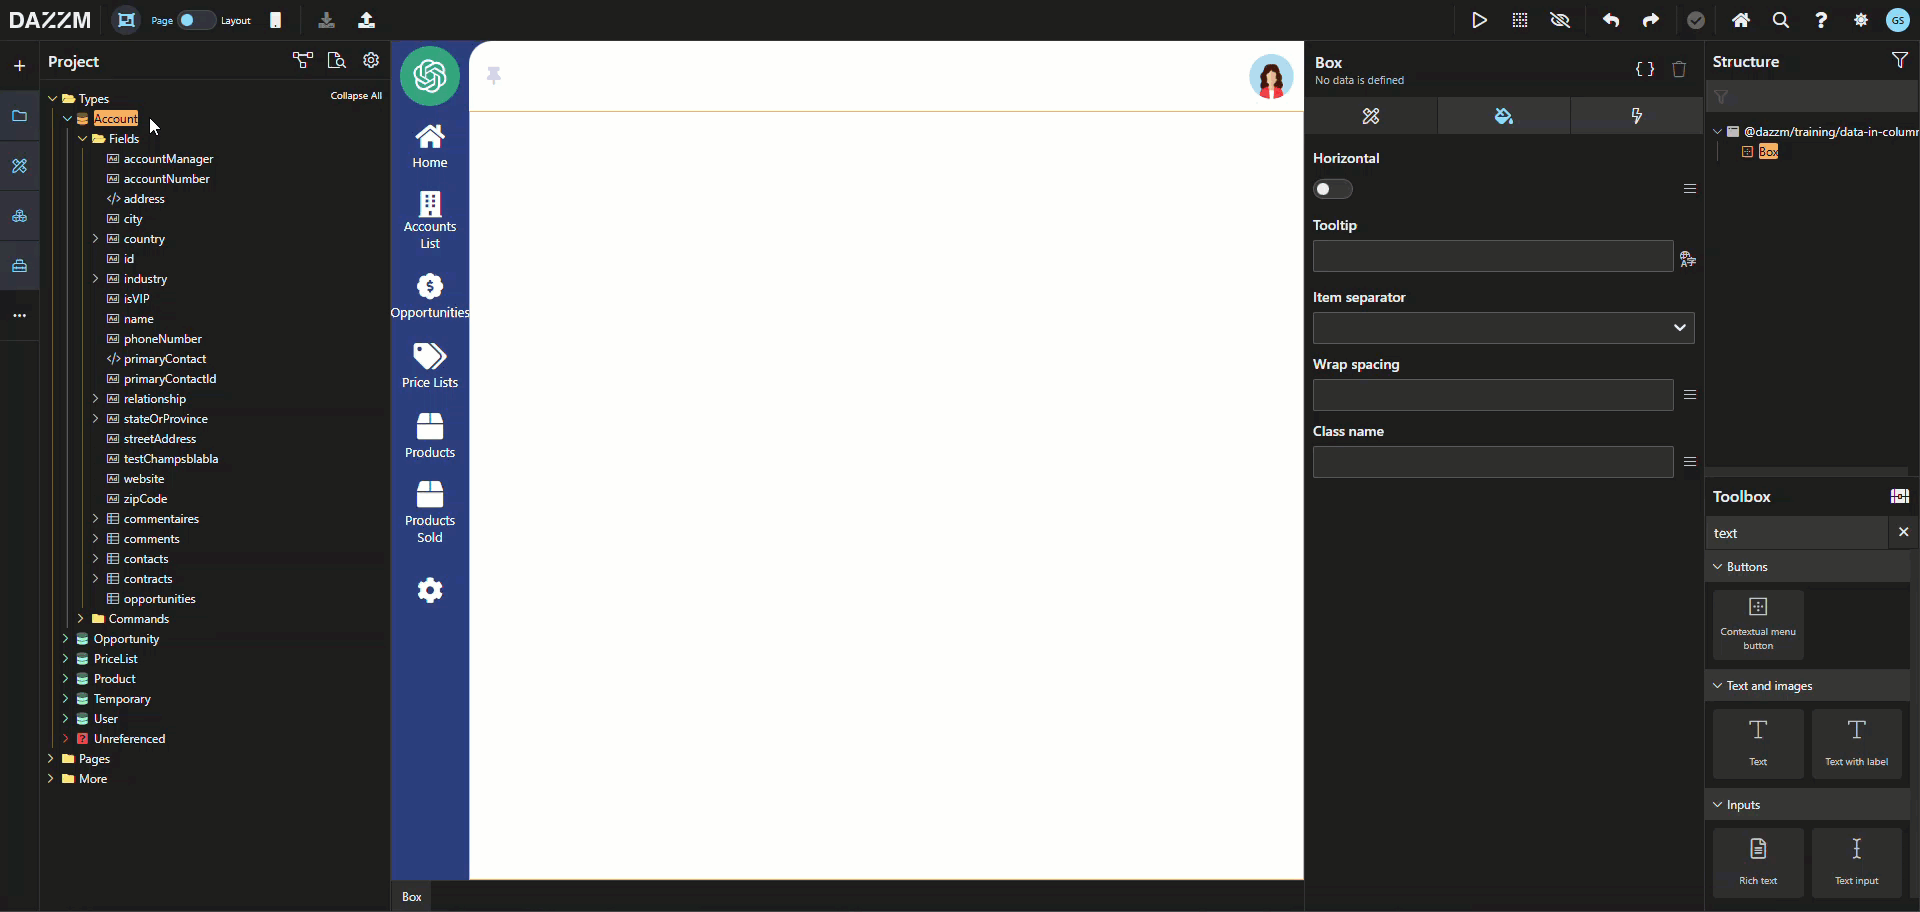
Section titled “Step-by-step instructions”1. Create a page of type “custom” where the table will be displayed.
Section titled “1. Create a page of type “custom” where the table will be displayed.”2. Create a Repeater from an Aggregate
Section titled “2. Create a Repeater from an Aggregate”In our example, we use the “Accounts” aggregate.
a. From the “Attributes” tab, change the orientation of the “Repeater” to “Horizontal”.
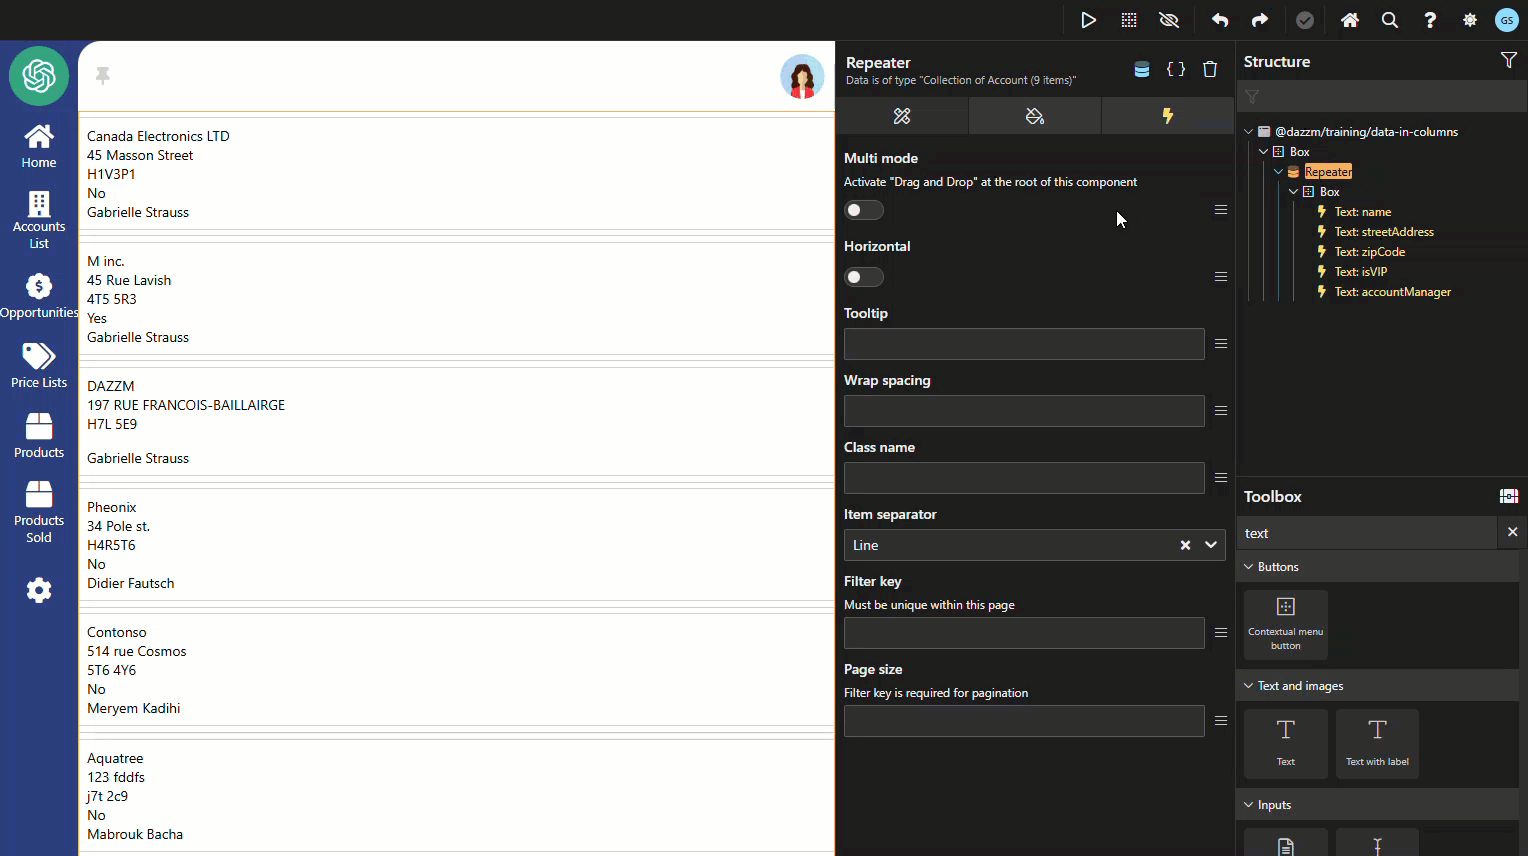
b. Remove all fields from the “Repeater”.
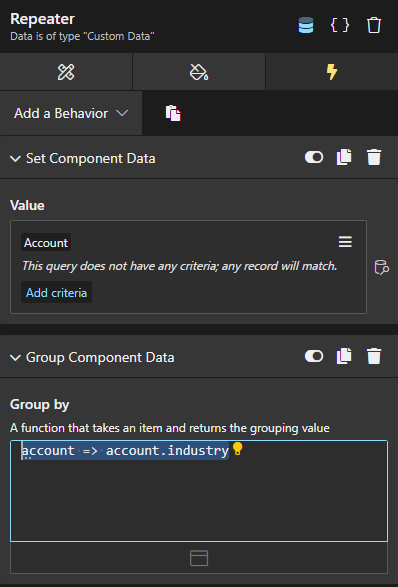
c. Add a behavior called “Group Component Data” to group the data.
This behavior specifies the field used for grouping, which in our example is “Industry”. Write:
account => account.industryNote: This behavior changes the structure of the data received. Now, the “Repeater” will have as many records as there are industries (instead of accounts).
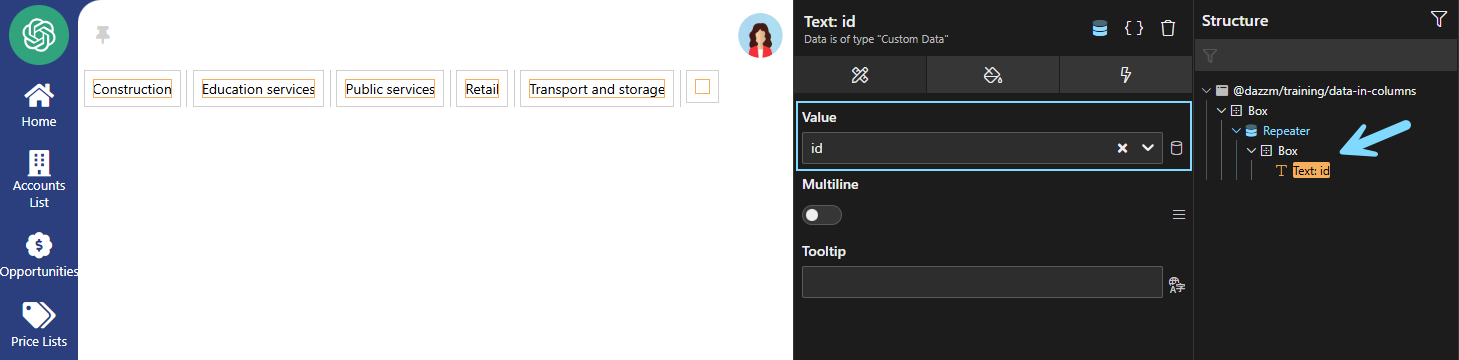
3. Add a Text Field in the Box under the Repeater
Section titled “3. Add a Text Field in the Box under the Repeater”In the “Attributes” tab, under the “Value” section, choose “Field” and write: id. This will form the columns.
Note: What is displayed are the values of the “id” field, which is the result of the “Group By” from Step 2-C.
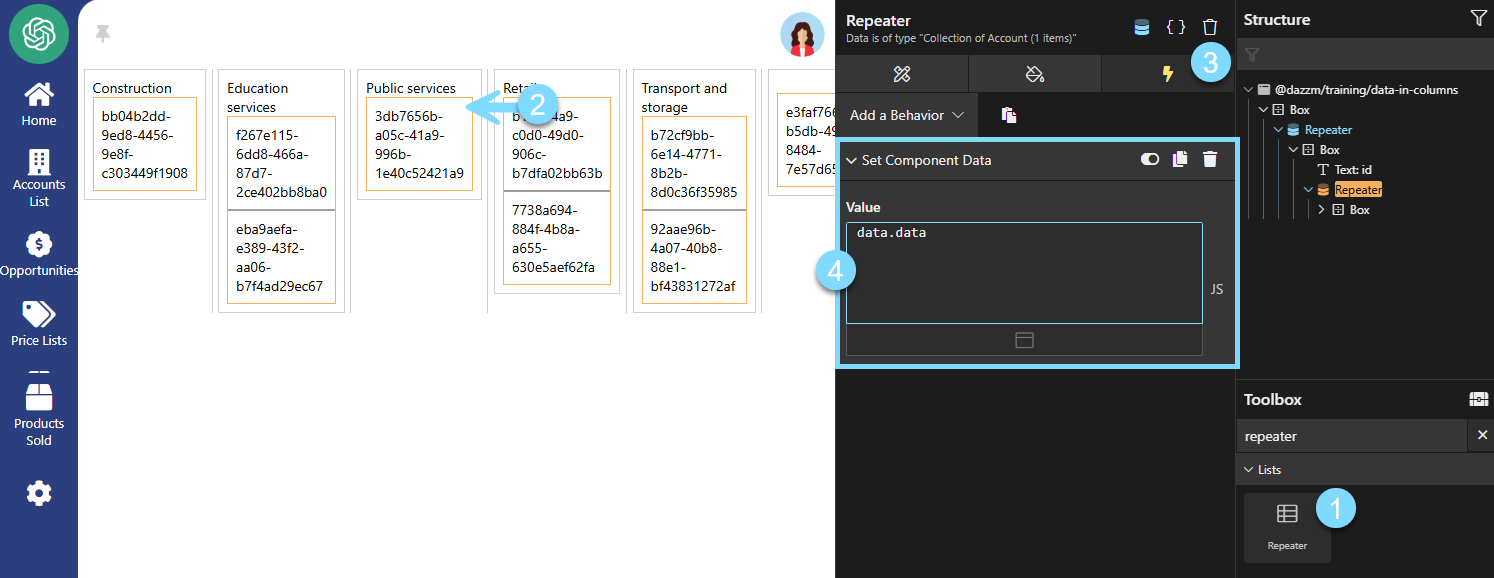
4. Insert a Second Repeater to Display Detailed Data
Section titled “4. Insert a Second Repeater to Display Detailed Data”Add another “Repeater” inside the first one using the toolbox.
Recommendation: Drag it onto the page into the “Industry” box.
Then, link it to the data (your list of accounts), which contains the grouped data. To do this, add a “Set Component Data” behavior of type JavaScript and write:
data.dataThe account IDs will instantly appear.
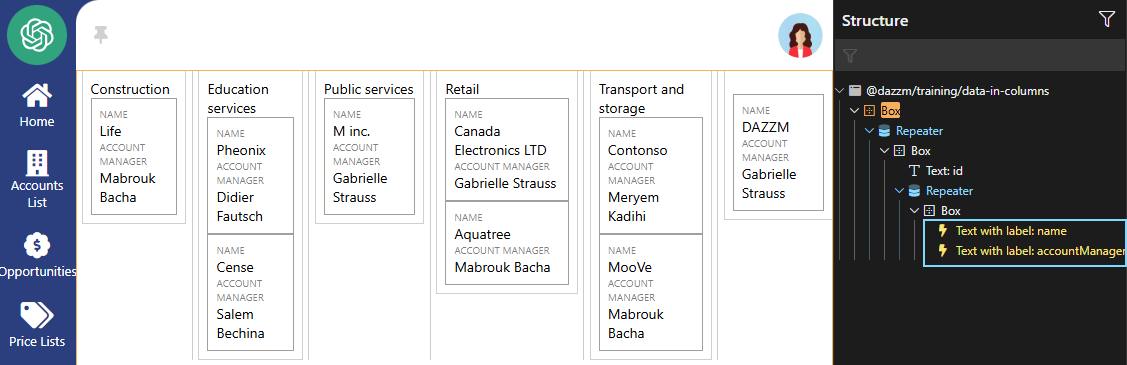
5. Add Specific Fields for the Accounts
Section titled “5. Add Specific Fields for the Accounts”From the “Project Explorer” panel, drag the fields you want to display into an “Account Card”, under the ID text. In our example, we drag the “Name” and “Account Manager” fields. Then, remove the field containing the ID.
6. Apply Visibility Conditions to the “id” and “None” Fields
Section titled “6. Apply Visibility Conditions to the “id” and “None” Fields”a. When an account does not have an industry, the value is empty. Create a conditional column header that will only appear in this situation. To do this, drag a text field from the “toolbox” directly onto the page, inside the “box” under the industries. Then, in the “Attributes” tab, enter the value: None.
b. To make this text component visible only when the id value is empty, add the behavior “Show Component Based on a Condition” and enter:
!data.id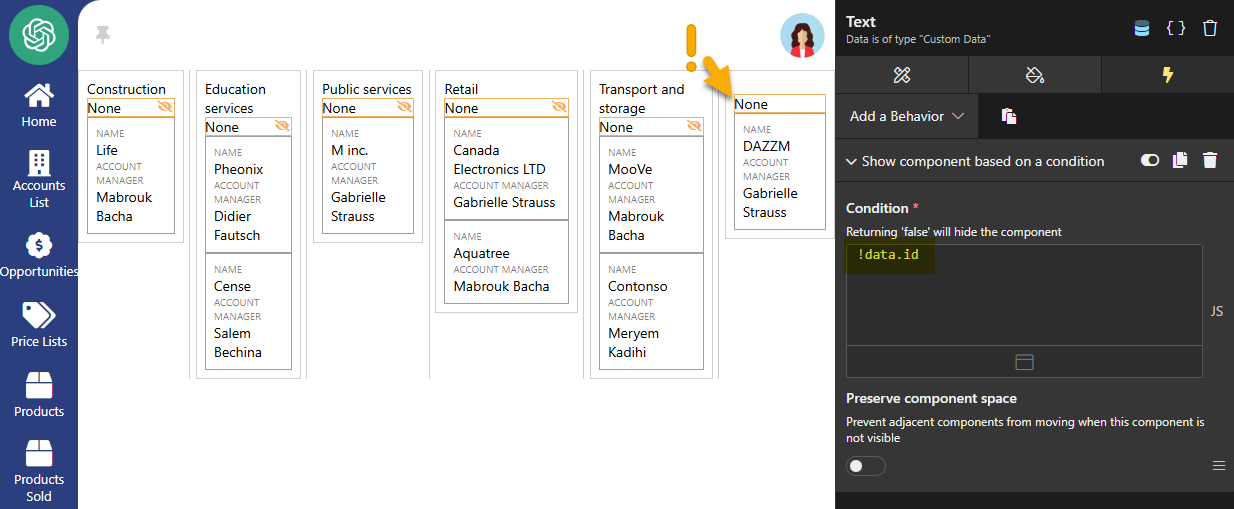
c. Then, apply the opposite condition to the “id” field:
!!data.id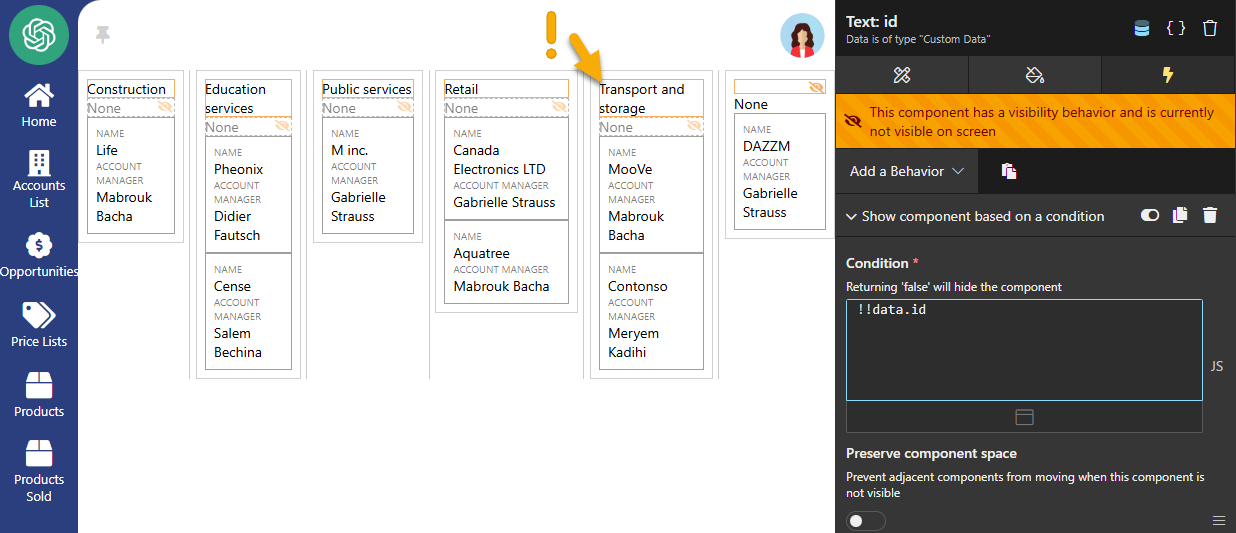
Result for Step 6: You now have headers for empty industries.
Bonus: Style the Table to Improve Visual Appearance
Section titled “Bonus: Style the Table to Improve Visual Appearance”Add some style to make the table visually appealing:
-
Adjust padding, margins, and fonts.
-
Use fixed column widths.
-
Enable horizontal scrolling if there are too many columns.
Conclusion:
Section titled “Conclusion:”Presenting data in columns requires structuring the data into clear groups, adjusting the presentation using specific behaviors, and applying styles for an optimal rendering. These steps ensure an intuitive and organized visualization of the data.